
In physics, frequency is measured in Hz and is defined as the number of cycles per unit time. Angular frequency is the rate of change of the phase of a sinusoidal waveform, and its unit is radians per second.

Here, △0 and △t represent the changes in phase and time respectively. Usually, there will be a carrier frequency offset (+CFO), and the reasons for this are typically two.
1. [Frequency mismatch between the oscillators at the sending and receiving ends] No two devices are exactly the same. The manufacturer's nominal specifications always have some discrepancies from the actual frequency of the device. Moreover, this actual frequency will (slightly) change with factors such as temperature, pressure, age, and others.
2. [Doppler effect] Any movement of the sending end, receiving end, or the surrounding environment of the channel will cause the Doppler effect, resulting in a frequency offset of the carrier wave. We will discuss in detail the relevant content of wireless channels in another article.
In order to observe the effect of carrier frequency offset (FA), consider again a received band communication signal consisting of two PAM waveforms, in the 1 and Q channels.
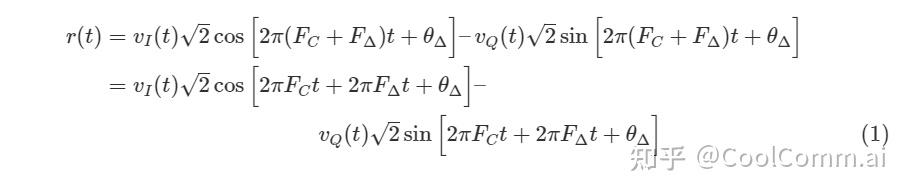 Here, the influence of the carrier frequency offset can be understood as 2xFAt, which is the phase that changes over time. Let's take a look at how to find FA,max, that is, the maximum value that the carrier frequency offset can reach.
The accuracy of the local oscillator in a communication receiver is defined in terms of ppm (parts per million). 1 ppm literally means 1 part out of 1,000,000. To get a sense of the magnitude of this number, 1,000,000 seconds is equivalent to below:

Therefore, 1 ppm is equivalent to an offset of 1 second every 11.5 days. This might seem insignificant, but for typical wireless communication systems operating at carrier frequencies of a few GHz and symbol rates of a few MHz, this is one of the main sources of signal distortion.
The ppm rating of the crystal indicates the extent to which its frequency may deviate from the nominal value. Taking a wireless system with a working frequency of 2.4 GHz and a crystal ppm of ±20 as an example, this is a relatively standard rating. The maximum deviation of the carrier frequency at the transmitting or receiving end can be:

However, in the worst-case scenario, the transmitting end could be 20 ppm higher (or lower) than the nominal frequency, while the receiving end could be 20 ppm lower (or higher) than the nominal frequency, resulting in a total difference of 40 ppm between the two. Therefore, in this example, the worst-case CFO caused by the mismatch of the local oscillator could be:

Please remember that this calculation is based on the basic accuracy, and the actual frequency may vary due to environmental factors (mainly temperature and aging). Finally, moving anywhere within the channel (whether at the transmitting end, the receiving end, or other objects in the environment) will introduce Doppler frequency shift, with the maximum reaching several hundred hertz. Although this Doppler frequency shift is far smaller than the mismatch generated by the oscillator, it causes changes in the channel and will severely distort the signal at the receiving end.
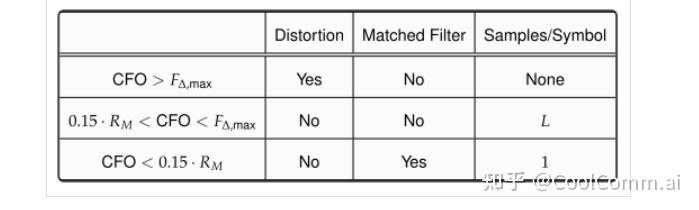
Now let's turn our attention to the following diagram to distinguish between the three possibilities for the receiver design. F∆ can determine these three options.
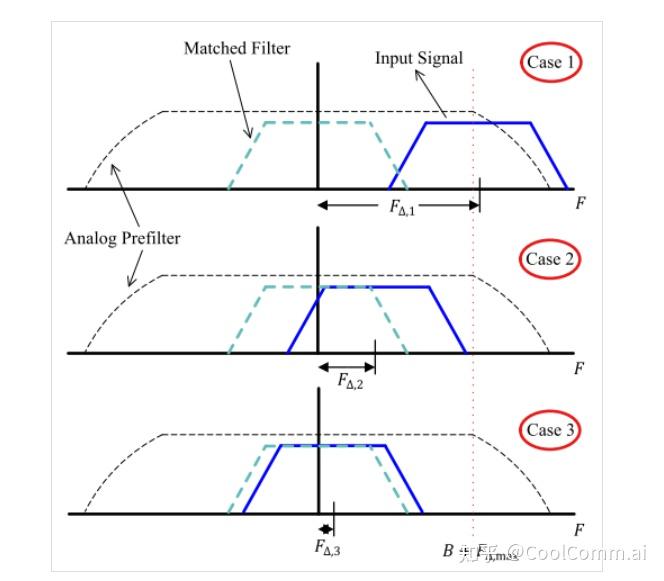
Situation 1: CFO > F∆,max
In another article, it has been explained that the input signal on Rx is filtered by an analog pre-filter to remove out-of-band noise. Ideally, the frequency response G(F) of this pre-filter should be flat within the frequency range.

So that the input signal can pass through without distortion (we also assume here that the channel is flat; the actual wireless channel will be discussed later). The passband width of this pre-filter is designed based on the expected maximum CFO F∆,max at the Rx location.
However, if CFO is greater than F∆,max, then most of the actual expected signal will be filtered out by the analog pre-filter, and the Rx sampling signal will not even approximate the Tx signal as a linear function of the Tx data. At this point, any signal processing cannot restore the signal. Since this is the result of poor system design, the only remedy is to redesign the system (especially the analog front-end) to more accurately estimate CFO and other similar random distortions.
Case 2: 15% < Rm < F∆,max
Since CFO < F∆,max, the Rx signal is within the passband of the analog pre-filter G(F) and will not suffer from distortion. However, to maximize the signal-to-noise ratio, remember that the Rx signal must pass through the matched filter. In this case, this is impossible because since CFO is greater than 15% of the symbol rate Rm, most of the bandwidth of the Rx signal overlaps insufficiently with the matched filter. If applied, it will remove most of the energy of the incoming signal.
Since the Rx signal cannot be matched-filtered without distortion through the matching filter, and the signal cannot be downsampled to 1 sample per symbol without the matching filter, it is easy to infer that more than 1 sample per symbol (for example, L samples) are needed to track the frequency offset.
Case 3: CFO < 15% Rm
When the signal rotation is less than 15% of the symbol rate Rm, an offset period can be completed within fewer than 7 symbols. Therefore, the rotational effect on a symbol, although still significant, can now be tracked at the symbol rate or at a rate of 1 sample per symbol. In other words, the matched filter retains the majority of the signal integrity, so before estimating the symbol interval samples for the carrier frequency to account for inter-symbol interference (ISI), the symbol boundaries can be marked (a problem we discuss in another article called symbol timing synchronization).
Without noise, the mismatched sampling version in equation (1) becomes 2πF∆nTs. Now equation (1) is very similar to the phase rotation equation, so we can directly use this result for appropriate substitution. In the case of CFO F∆, the expression for the symbol interval samples can be obtained by replacing the sample time index n with the symbol time index m.
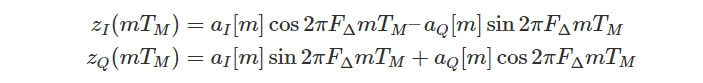
In the above equation,

Among them, F0 is defined as the normalized carrier frequency offset (nCFO): that is, CFO divided by the symbol rate.

This normalization is very important, as we saw in the previous section. The resulting expression takes the form of:

In polar coordinate form, this expression can be written as:

From the above equation, it can be seen that the carrier frequency offset F∆ maintains the amplitude unchanged, but continuously rotates the expected output aI[m] and aQ[m] on the constellation plane. This is depicted in the following figure as scatter plots of the symbol interval samples for the 4-QAM and 16-QAM constellations:
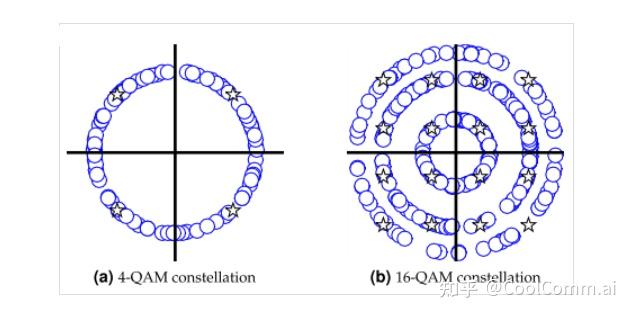
Due to this reason, the carrier frequency offset (CFO) in the received signal, or F∆, causes the constellation to rotate around the circle (possibly multiple circles for higher-order modulation). This is a natural outcome because the angular frequency is defined as the rate of phase change.
The above results are summarized in the following table: